 Contact
Graphs and Data for K–2 Math | Activities, Lessons, and Free Graphing Printables
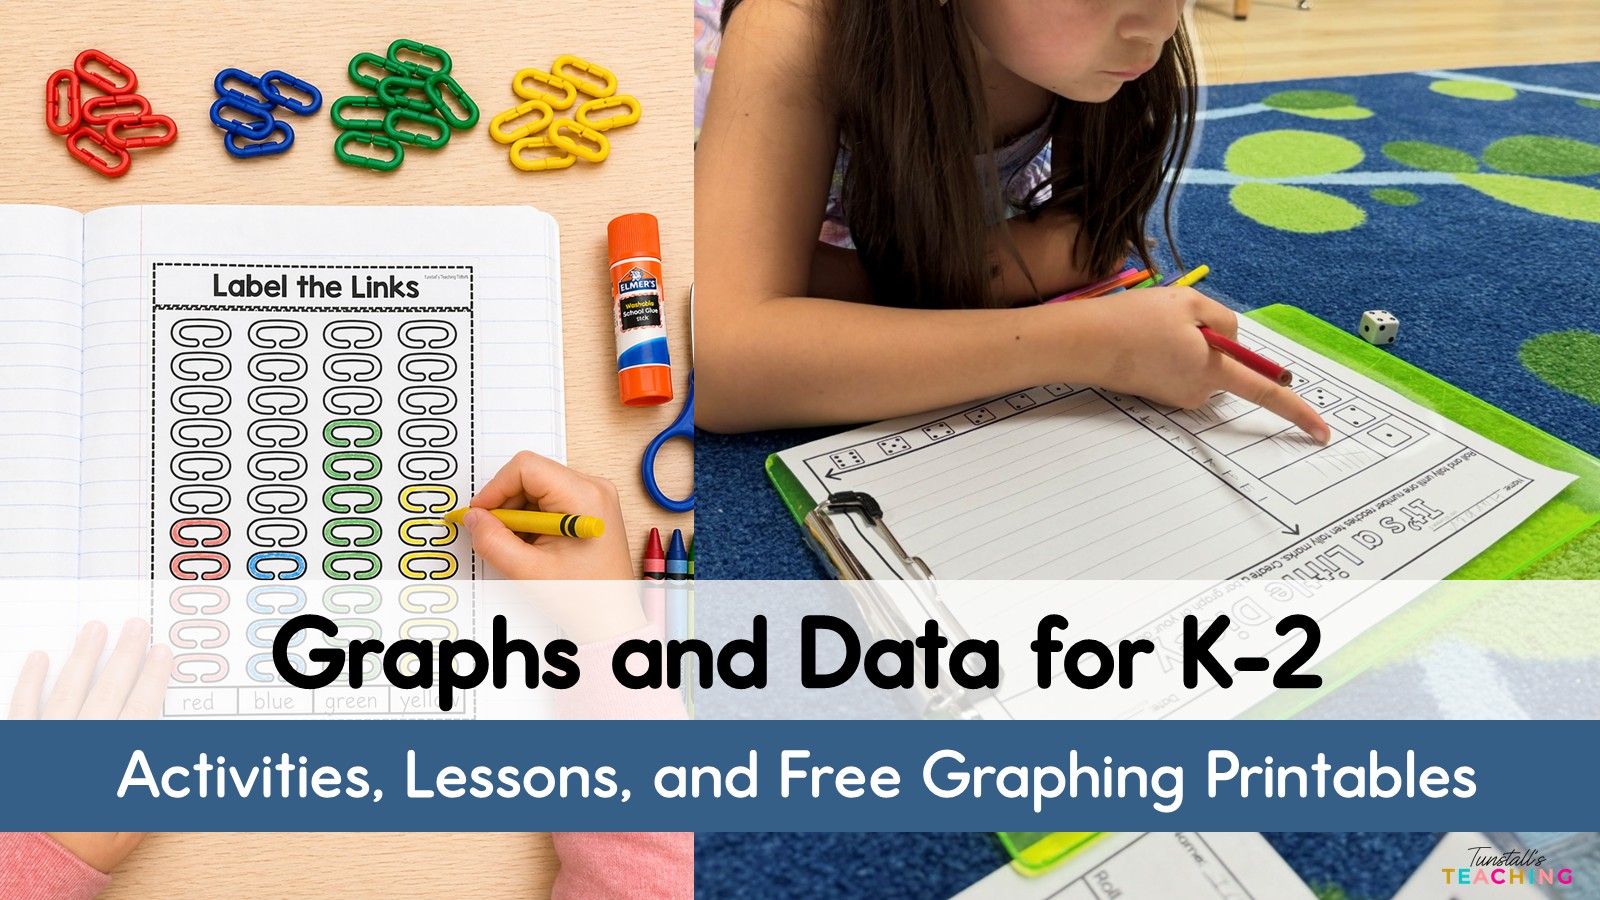
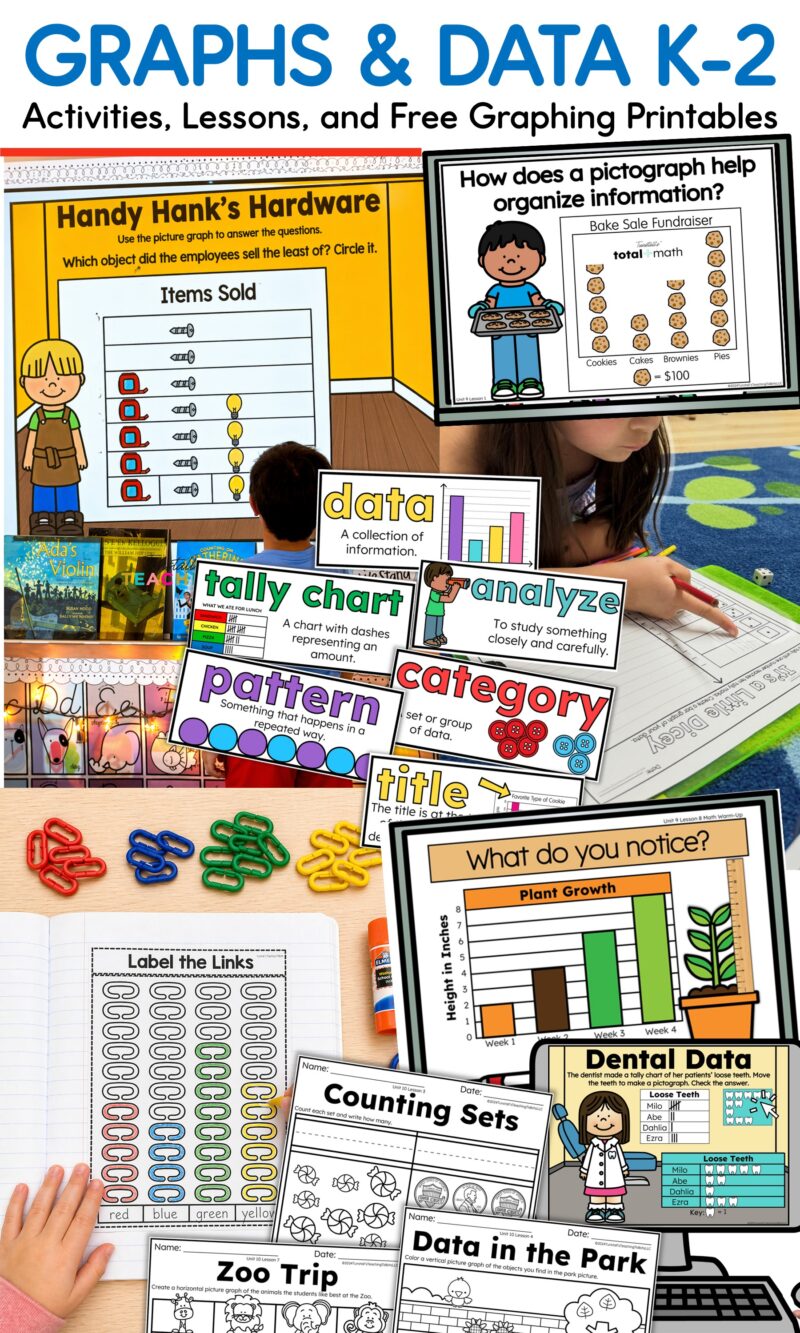
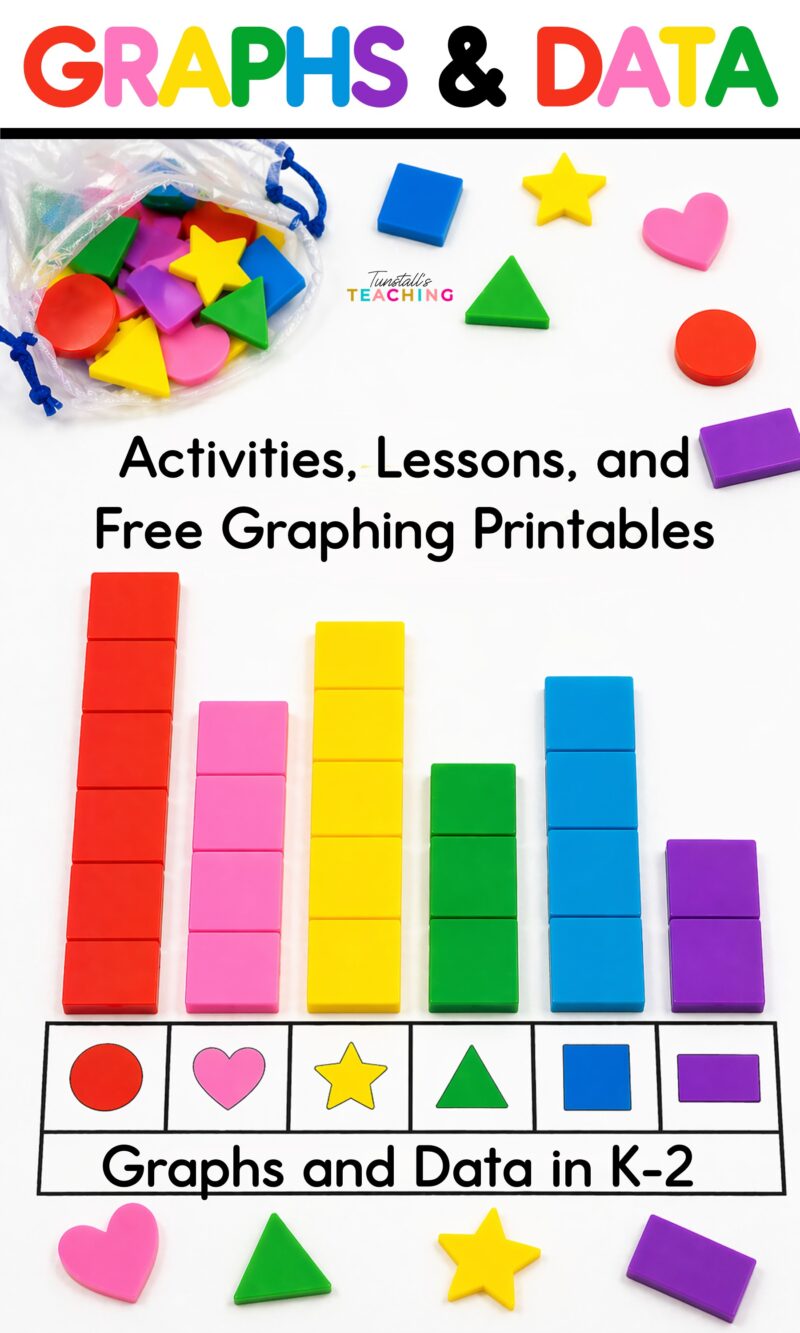
Graphs and Data K–2 Math
Teaching graphs and data K–2 math gives students their first real experience organizing information and making sense of it. With the right activities, even your youngest learners can collect, represent, and interpret data successfully.
In this post, you’ll find:
- Simple and effective graphing activities
- What students need to learn at each grade level
- Free graphing activities
- Complete lessons you can use for your entire math block
All links for free downloads and full graphs and data can be found near the end of this post.
Why Graphs and Data Can Be Difficult for K–2 Students
Working with data requires several layers of thinking at once.
Students must:
- Organize information
- Compare quantities
- Ask and answer questions
- Explain their thinking
One of the biggest challenges is that data is not always concrete. Students may count objects, but interpreting what those numbers mean is a new level of thinking.
Without strong foundational experiences, students often focus on completing the graph instead of understanding it.
What Students Need to Understand Before Graphing
Before students can confidently work with graphs and data, they need a clear foundation.
Focus first on:
- Sorting and categorizing objects
- Counting and comparing groups
- Understanding how data answers questions
- Connecting real objects to visual representations
Using consistent visuals, repeated language, and modeled thinking helps students build this understanding early.
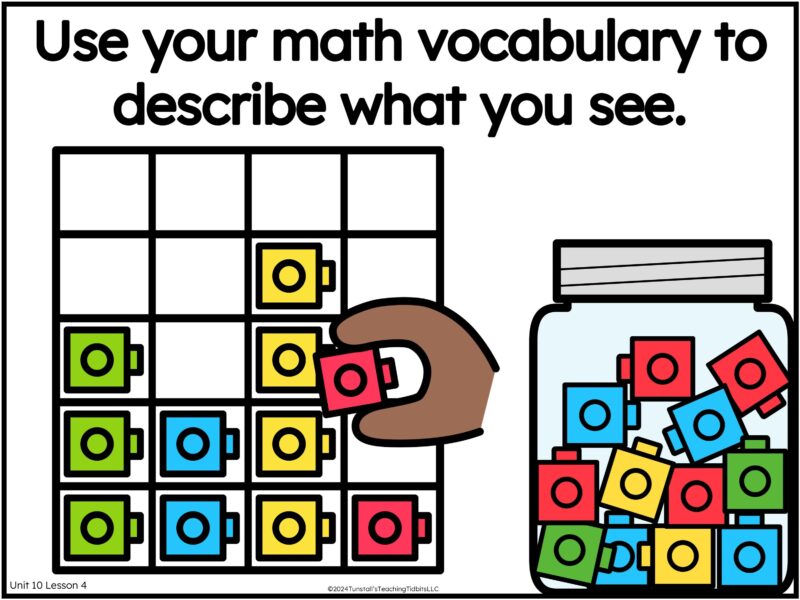
Math Vocabulary for Graphs and Data in K–2
When students are learning graphs and data, vocabulary plays a big role in helping them understand and talk about what they see.
Instead of introducing all the words at once, focus on building vocabulary naturally as students interact with data.
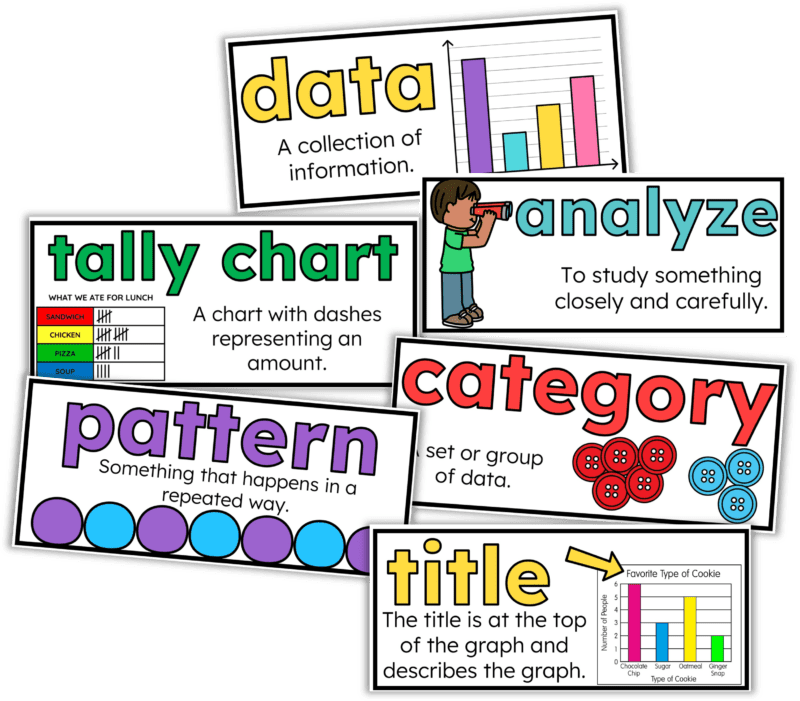
Students need repeated exposure to these words in context. Using visuals, sentence frames, and consistent language helps students connect the vocabulary to what they are actually doing
When students hear and use this language regularly, they begin to understand graphs and data at a deeper level. Place math vocabulary cards on a focus wall to remind both you and students to use the language of math.
How to Teach Graphs and Data Using Math Workshop Routines
Graphs and data become much more manageable when they are taught within a consistent structure.
Instead of isolated lessons, use a predictable routine that allows students to see, practice, discuss, and apply their learning.
Daily Instructional Flow
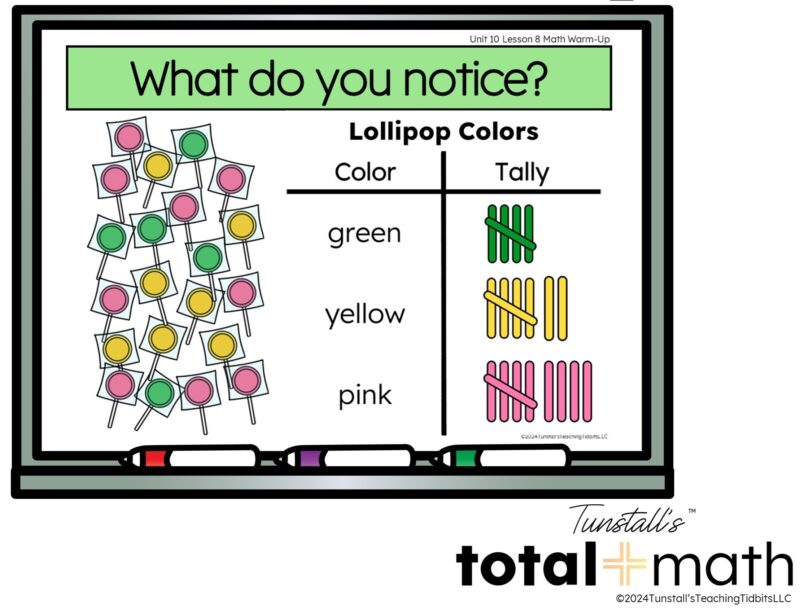
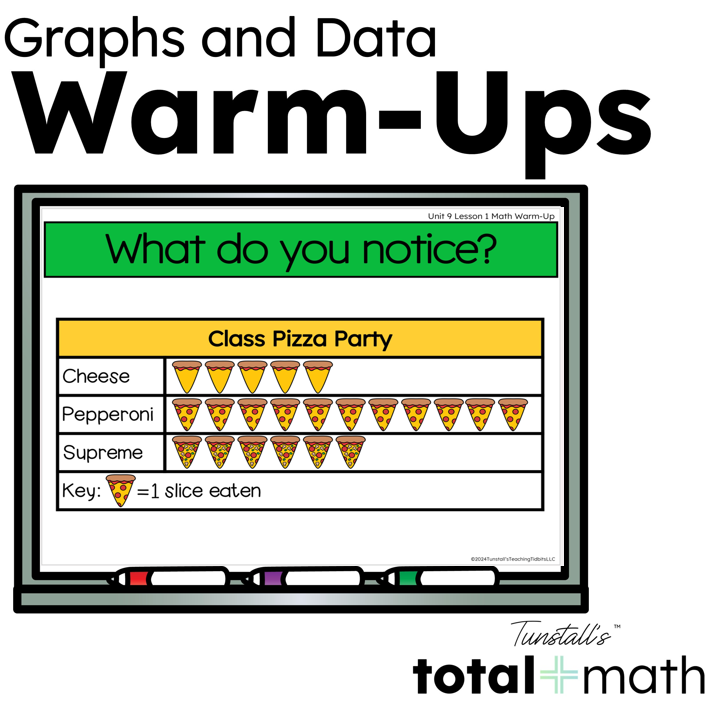
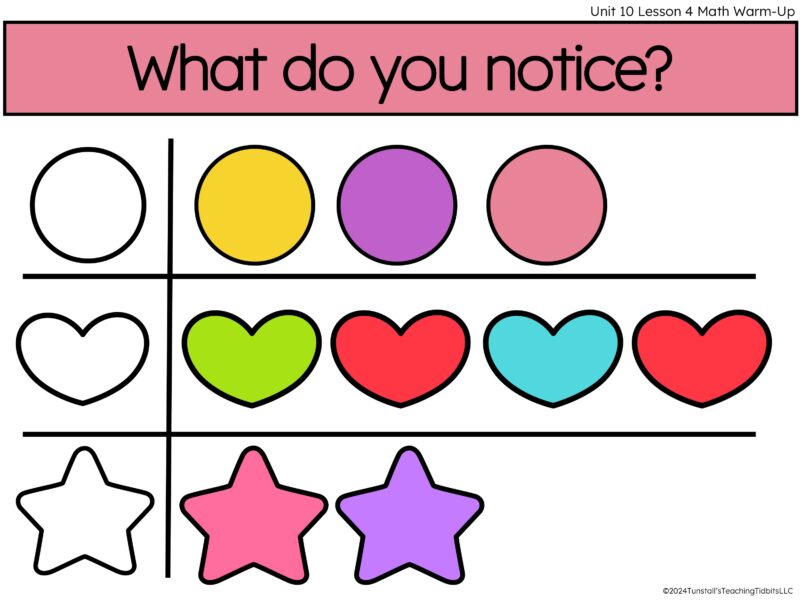
Warm-Up
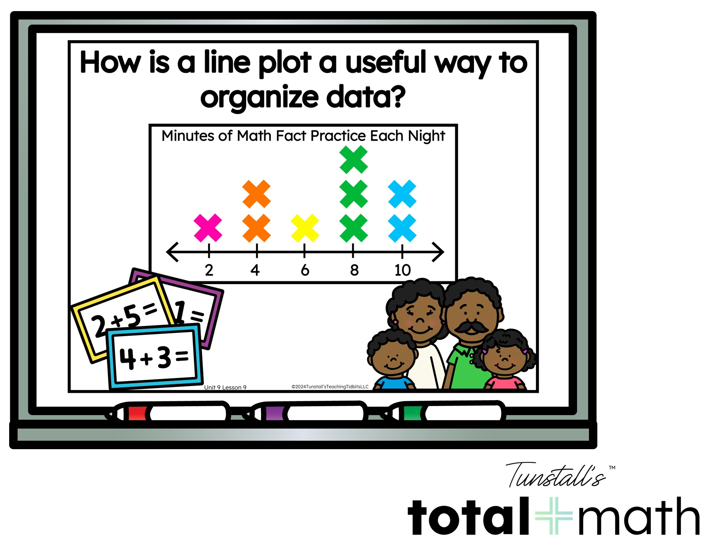
Review previously learned skills through quick, consistent practice. Each day in the study of data and graphs, students discuss an engaging graph slide as a class. These Warm-Up Slides provide a way to spiral review learning naturally. Every lesson for Total Math begins with a Math Warm Up Slide in kindergarten, First Grade, and Second Grade.
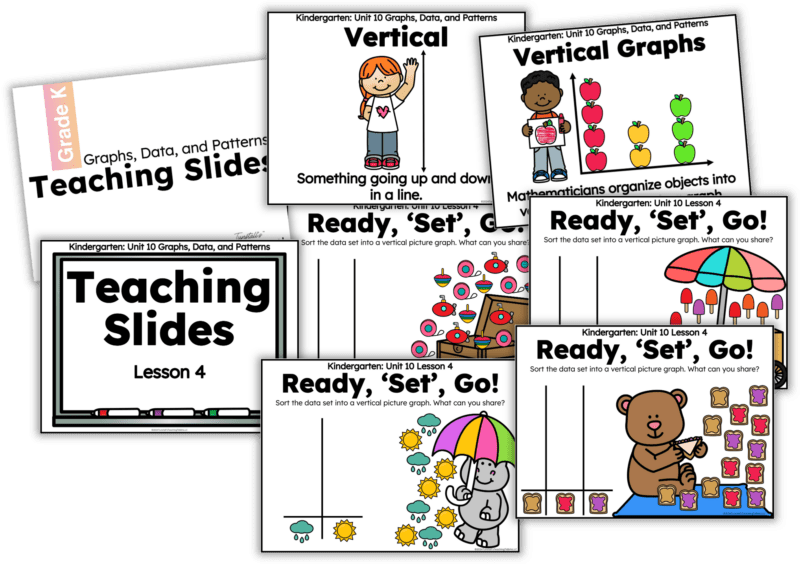
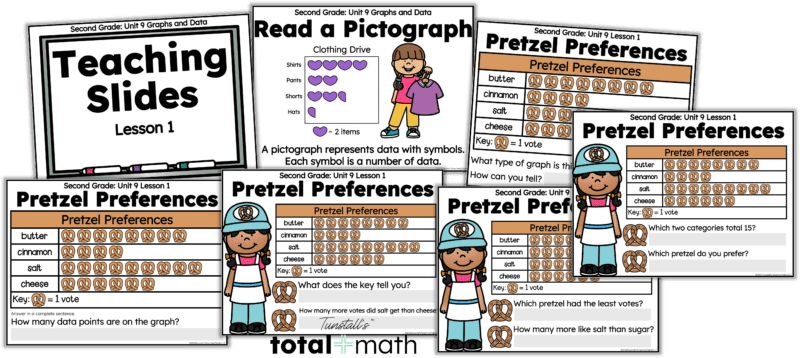
Mini Lesson
Model how to collect, organize, and represent data using clear visuals and think alouds. Interactive teaching slides help students see exactly how the process works.
Small Group Instruction
Work with students in a small setting to target misconceptions and build understanding using hands-on materials and guided support.
Graphs and Data Student Math Stations
Provide opportunities for students to practice working with data in different ways.
We use 4 student workstations in our math workshop:
- Hands-On Math
- Technology Game
- Application Page
- Learning Log
Each station reinforces graphs and data in a meaningful way. Below you can see an example of each.
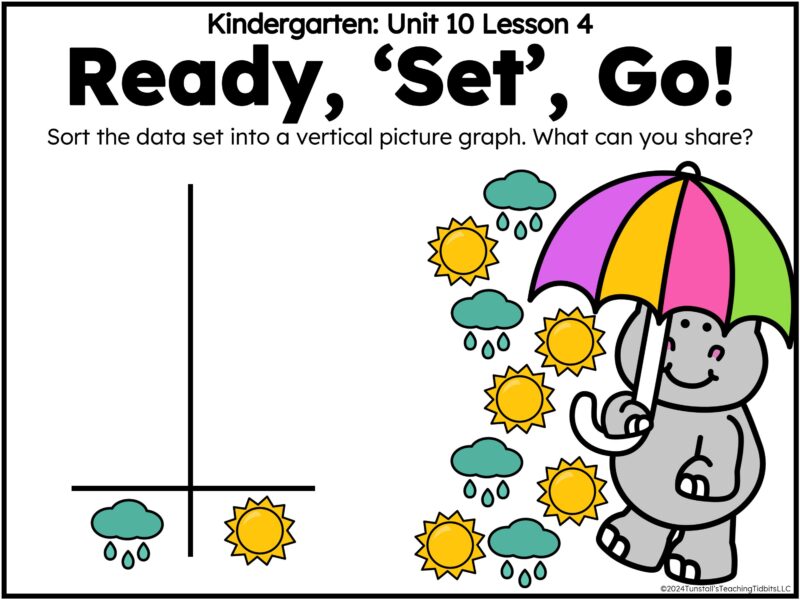
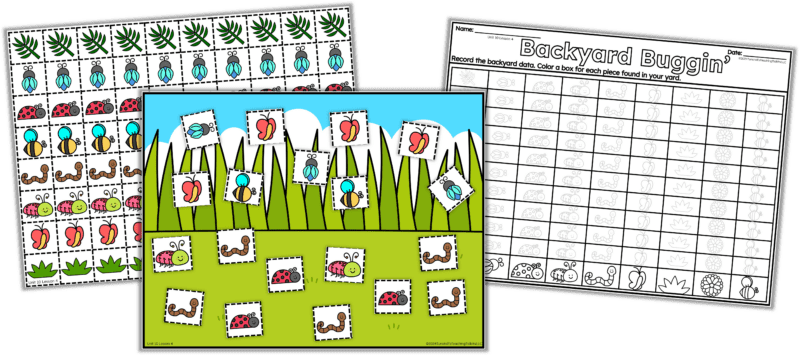
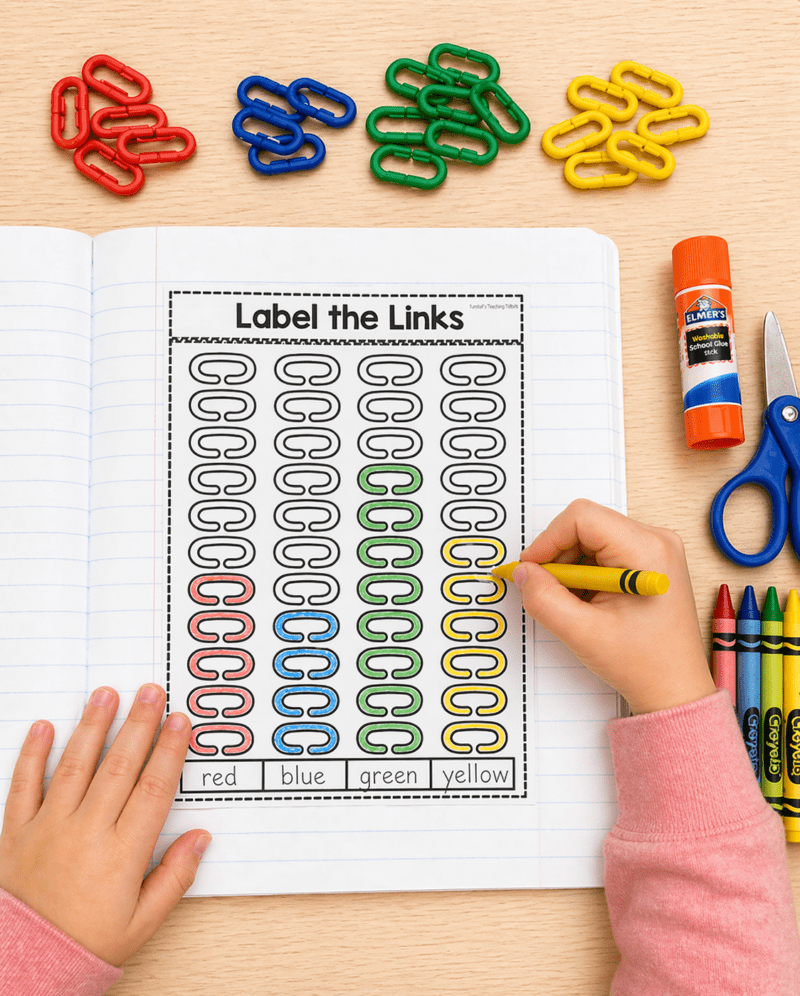
Hands-On Graphs and Data Activities for K–2 Math
Students need repeated, meaningful experiences with data. In the math learning progression, concrete hands-on activities lay the foundation of understanding. They are vital to building deep meaning.
Effective activities include:
- Sorting and graphing real classroom objects
- Creating picture graphs and bar graphs
- Asking and answering questions about data
- Comparing results and discussing differences
- Collecting data from real-life situations
These types of activities help students move beyond simply making a graph and into understanding what it represents.
Learning Log
The Learning Log gives students a quiet space to reflect, draw, and write about their thinking. In graphs and data, this might look like explaining what a graph shows, comparing categories, or recording observations. It is a simple way to build accountability while helping students process their learning in a meaningful way.
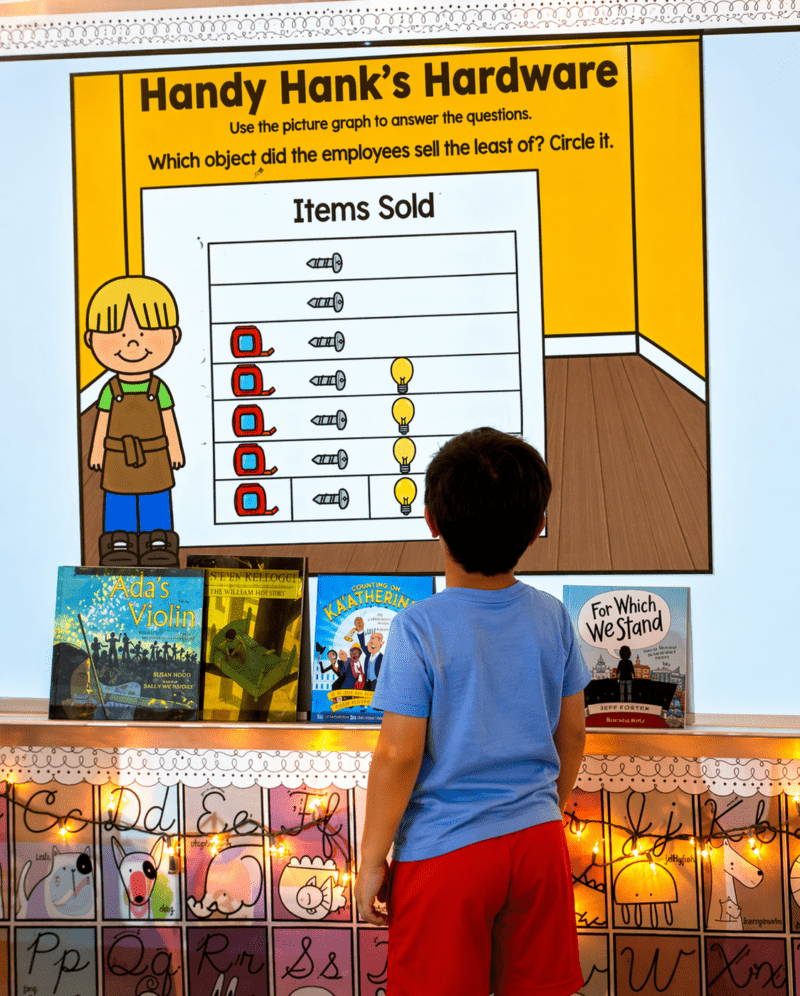
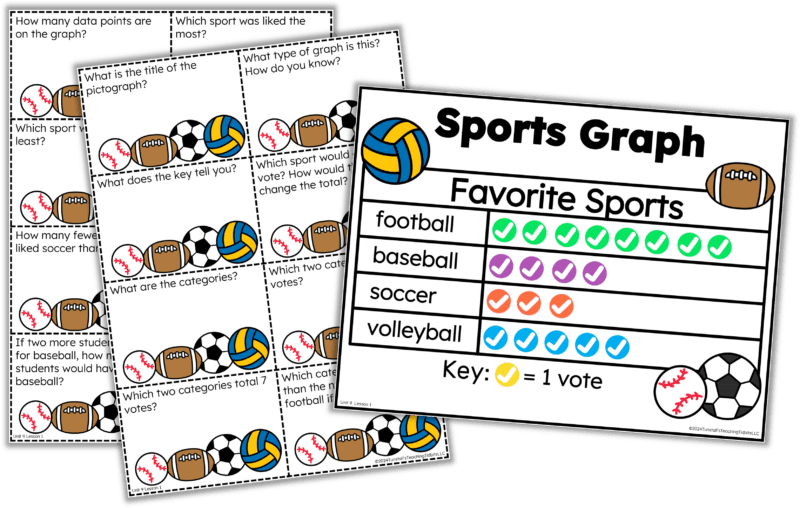
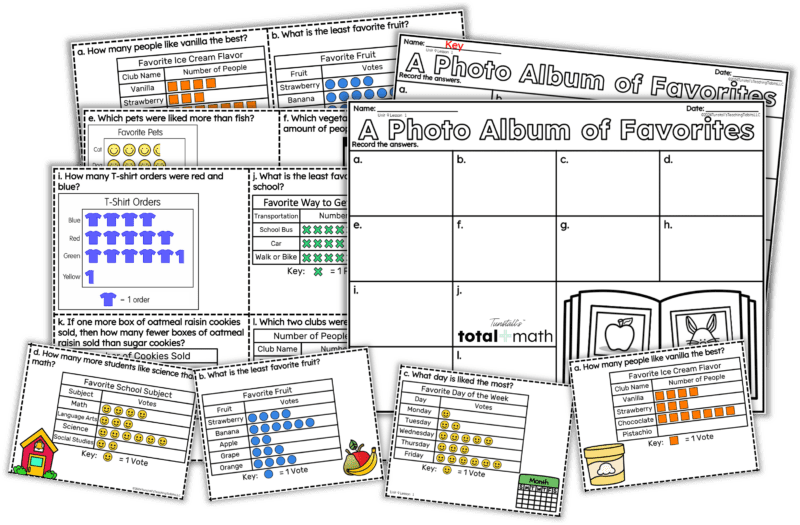
Application Station
The Application Station is where students apply what they have learned through graphing printables and hands-on tasks. Students might create their own graphs, answer questions about data, or work through real-world scenarios. This station helps connect the skill to actual understanding and gives students the practice they need to build independence.
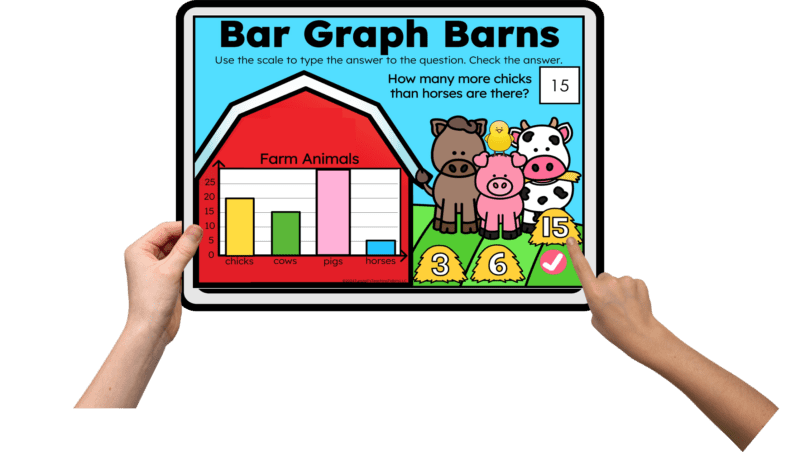
Math on Technology
Math on Technology allows students to practice graphing and data skills in an interactive format. These digital activities keep students engaged while reinforcing concepts like organizing data, reading graphs, and answering questions. It is an easy way to add variety while still staying aligned to your learning goals.
Using Math Strategies and Anchor Charts for Graphing
Clear visuals make a big difference when teaching graphs and data.
Math strategies anchor charts give students a reference they can use during lessons, small groups, and independent work.
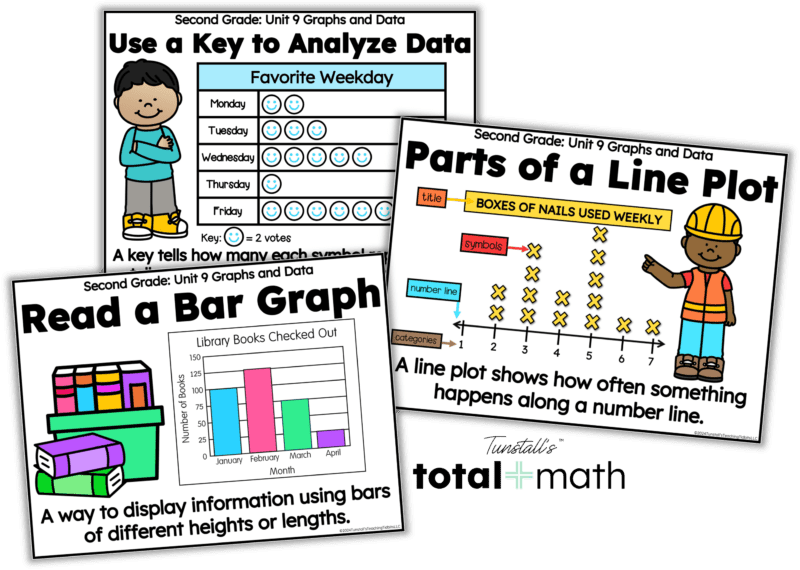
These types of visual supports help students move from just completing a graph to understanding what it represents.
Over time, students begin to rely on these strategies independently as they work with data.
Using Reflection Slides to Build Understanding in Graphs and Data
After every lesson there is a reflection slide to synthesize the learning and bring focus and closure to the target objective.
Reflection slides make this process simple and consistent.
Reflection can happen as a whole group discussion or through quick partner talk. Over time, students begin to use this language more naturally and develop stronger reasoning skills.
When reflection is built into your routine, students are not just making graphs. They are learning how to interpret data and communicate what it means.
Free Graphing Printables and Lessons for K–2 Math
If you want to see how all of these pieces come together, you can try a free graphs and data lesson for each grade level.
Each lesson includes all the digital slides components in this post along with downloadable graphing printables. Whether you want to supplement your curriculum with engaging research backed lesson components, or you want a full curriculum including workstations, Total Math can help.
Inside the free lessons for each grade level K-2, you will find:
- Lesson Plans
- Warm-up Slides
- Vocabulary cards
- Interactive teaching slides
- Small group lessons
- 4 Math stations
- Graphing printables for practice and application
- Reflection prompts
These graphing printables are designed to help students organize data, represent information, and answer questions about what they see, while the full lesson shows how everything fits together during your math block.
You can use the printables on their own or teach the full lesson for a more connected experience.
👉 FREE Kindergarten Graphing Lesson
👉 FREE First Grade Graphing Lesson
👉 FREE Second Grade Graphing Lesson
A Complete Graphs and Data Unit for K–2 Math
If you are ready to take this further, you can use a complete graphs and data unit for each grade level.
👉 FULL Kindergarten Graphs and Data Unit
👉 FULL First Grade Graphs and Data Unit
👉 FULL Second Grade Graphs and Data Unit
These Total Math units are designed to follow the same structure you saw in the free lessons, with everything planned and organized so you can teach graphs and data with consistency throughout your math block.
Each unit includes:
- Daily warm-up slides to build and review skills
- Vocabulary cards to support math language
- Interactive teaching slides for whole group instruction
- Teacher-led small group lessons
- 4 aligned math stations for every lesson
- Graphing printables for practice and application
- Reflection slides to guide student thinking
- Assessments to check for understanding
Instead of teaching graphing as a one-time lesson, these units help students build their understanding over time through repeated practice, discussion, and application.
This allows students to move beyond creating graphs and begin interpreting and explaining what the data shows.
👉 Kindergarten Graphs and Data Unit
👉 First Grade Graphs and Data Unit
👉 Second Grade Graphs and Data Unit
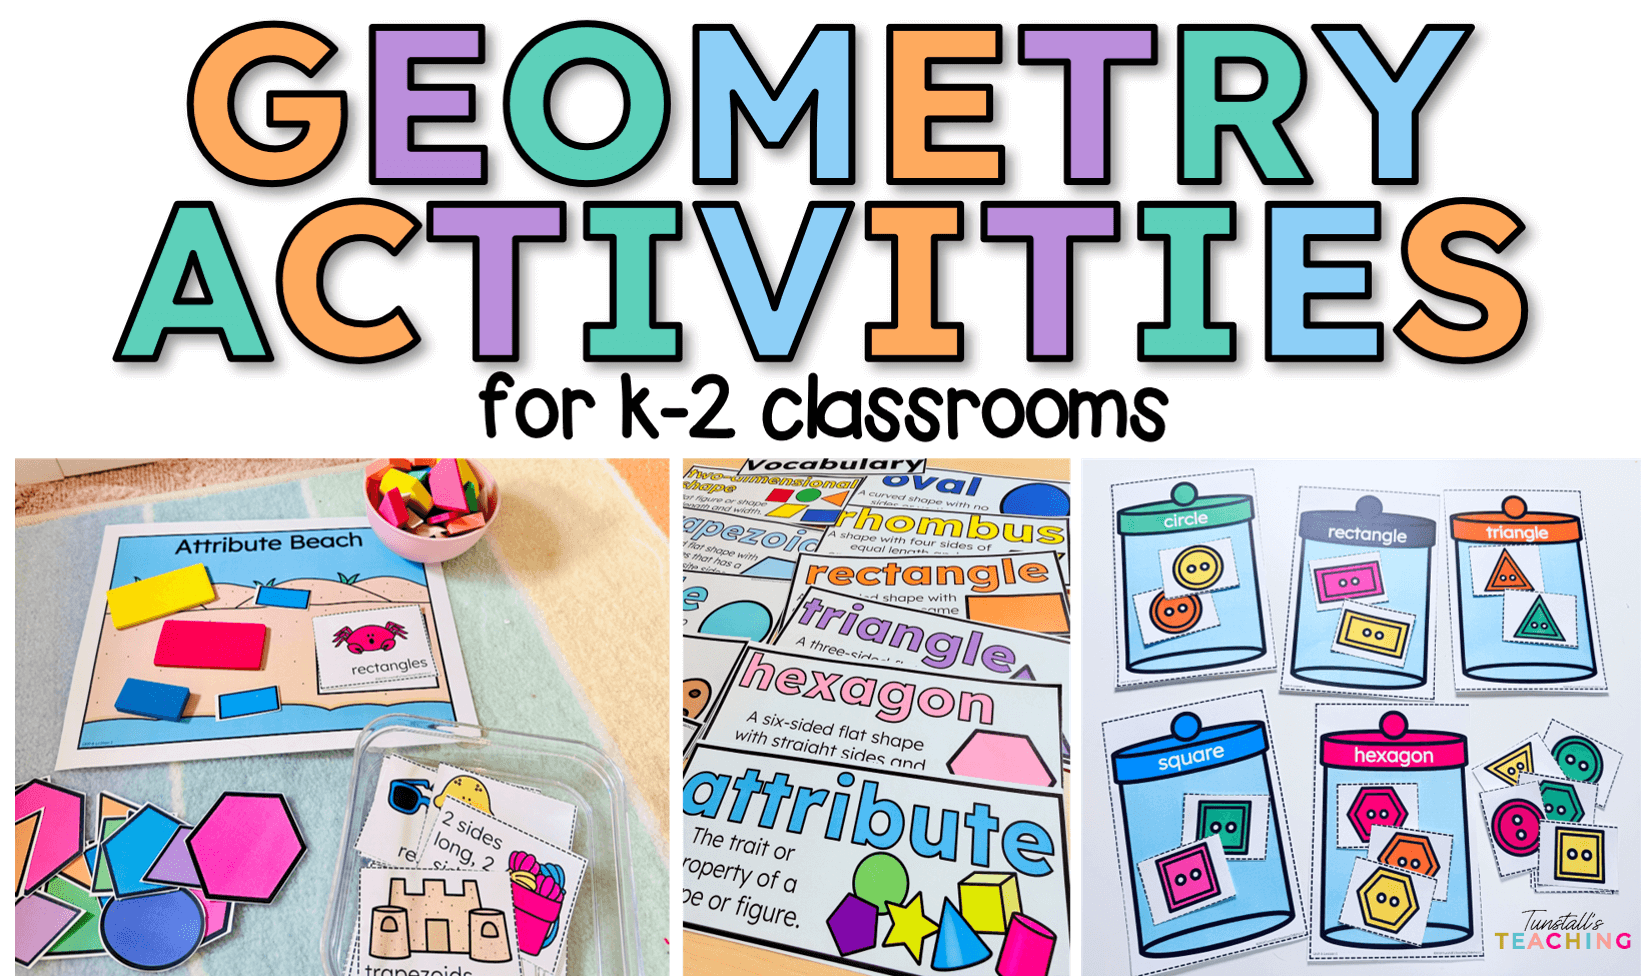
For more activities that follow the same framework as this graphs and data unit, our geometry lessons for K-2 will fit the bill.