20 Ways to Teach Graphing
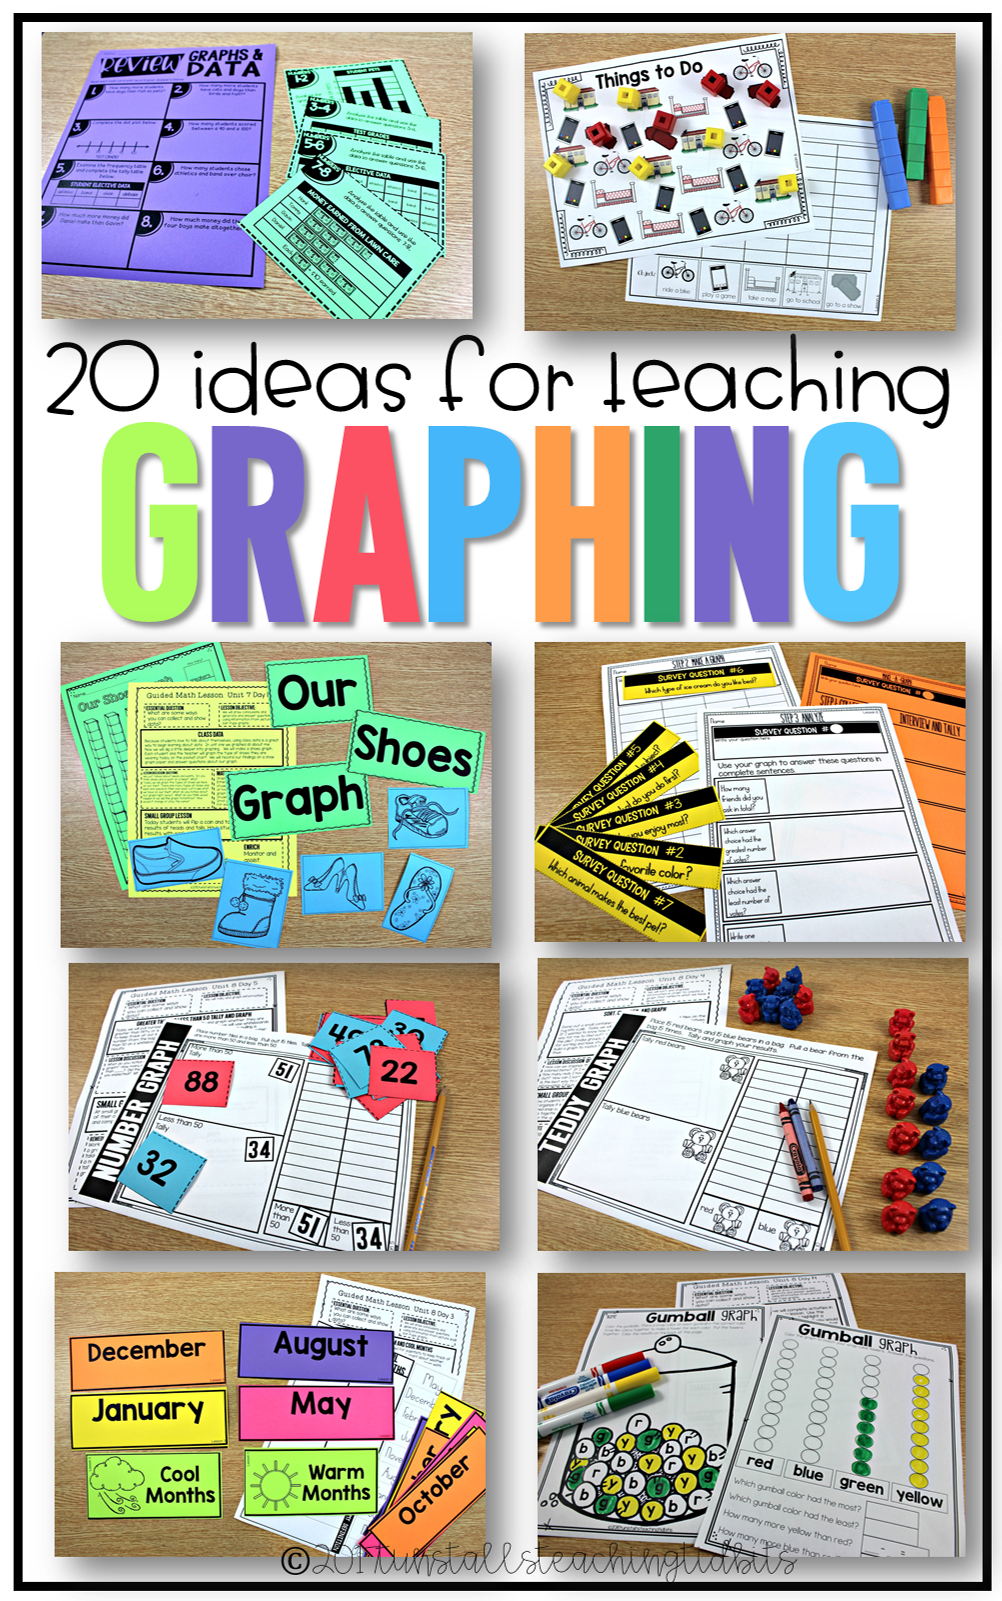
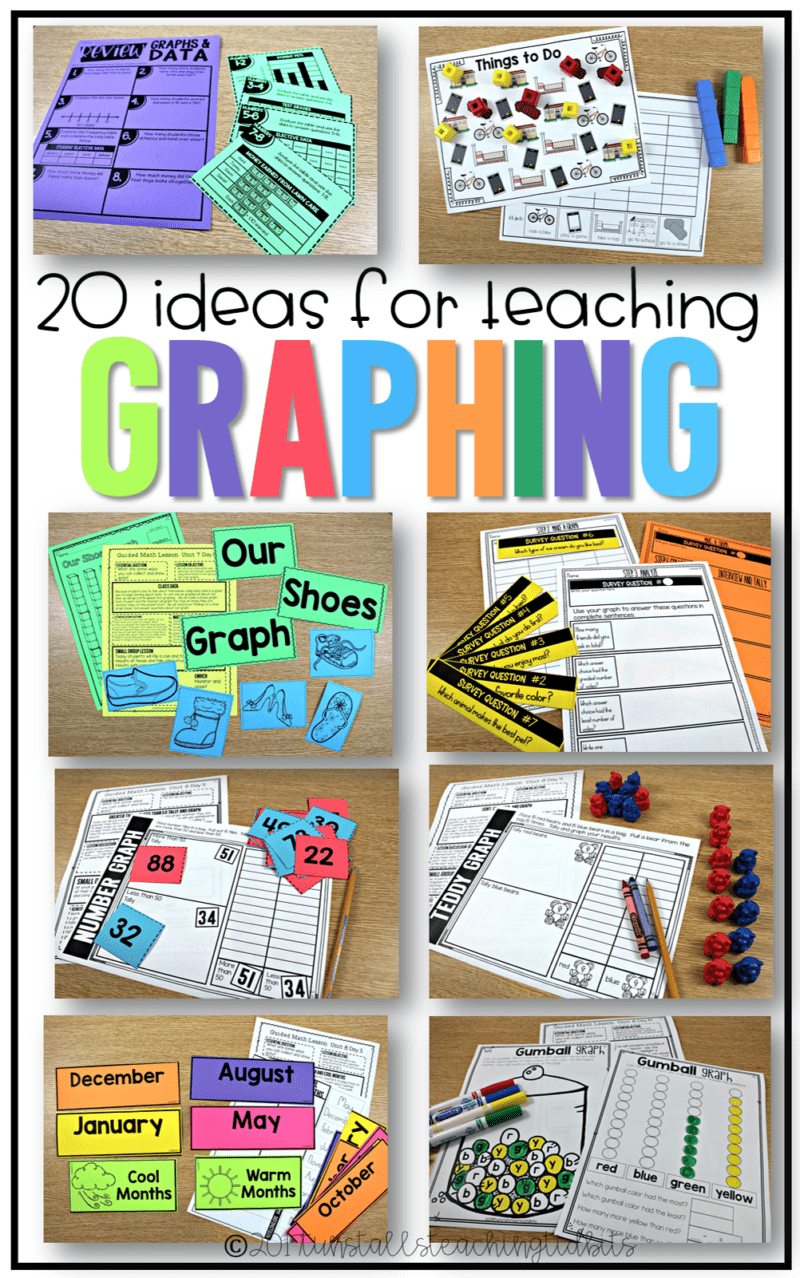
Graphs are commonly referred to as charts and are usually data which can be represented by symbols. In a world of info-graphics and constant data overload, graphing is not only necessary, but essential! Whether you work with young children or intermediate kids, this post has 20 ways to teach important graphing concepts!
Surveys and Bar Graphs
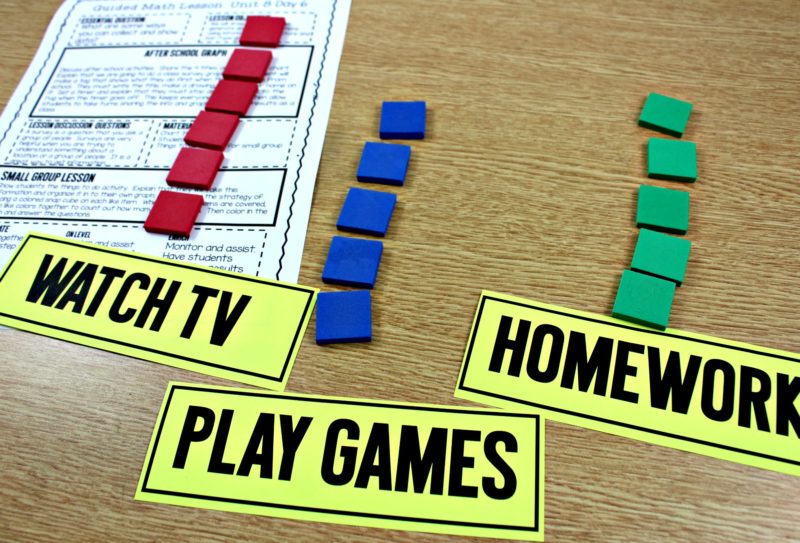
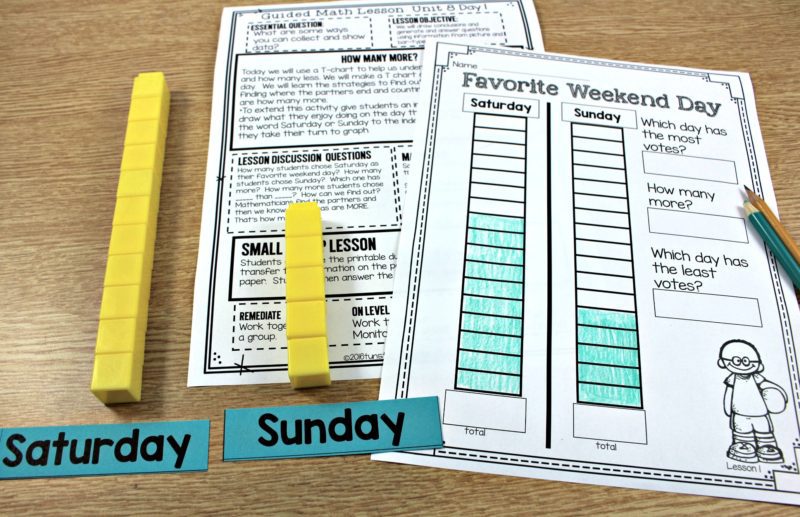
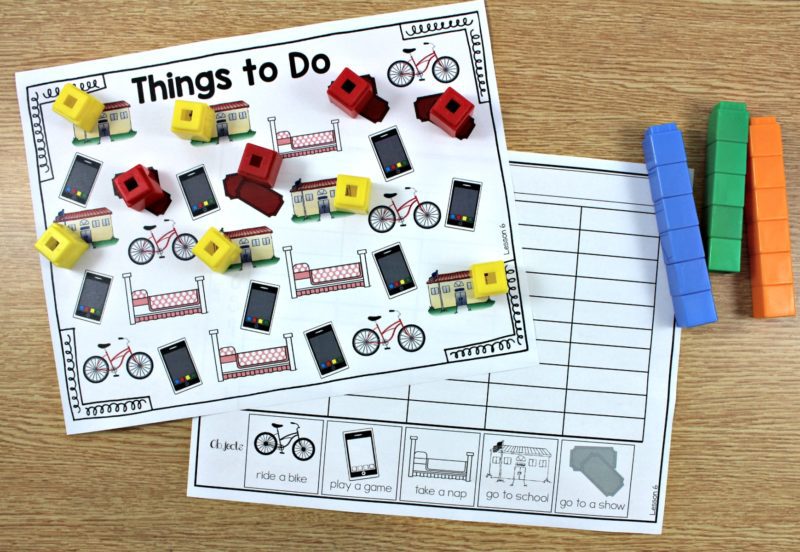
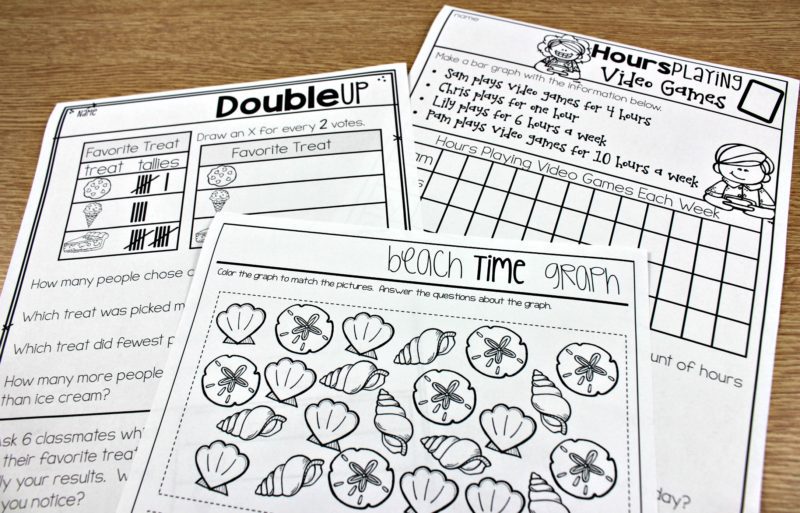
If you have spent more than 5 minutes with a child in your life or teaching career, you know that students love to share their own experiences out loud! Graphing is a tangible way for students to see how their experiences compare with others in their class! In the guided math series for first and second grades, many of the graphing lessons revolve around surveying students and displaying results. Once the results are displayed, the analyzing of the information can begin! Notice that students don’t just build the pictograph on a pocket chart together, but they also build it in bar graph form at a table group or on the rug. This helps students to understand that the pictures represent a value. For now that value is one, but later we can get into multiples when our students are ready! Third grade, I’ve got you covered further down in the post, but students in third grade with gaps in their understanding of graphing can benefit from all of these lessons.
What do you do first after school?
Which weekend day is your favorite?
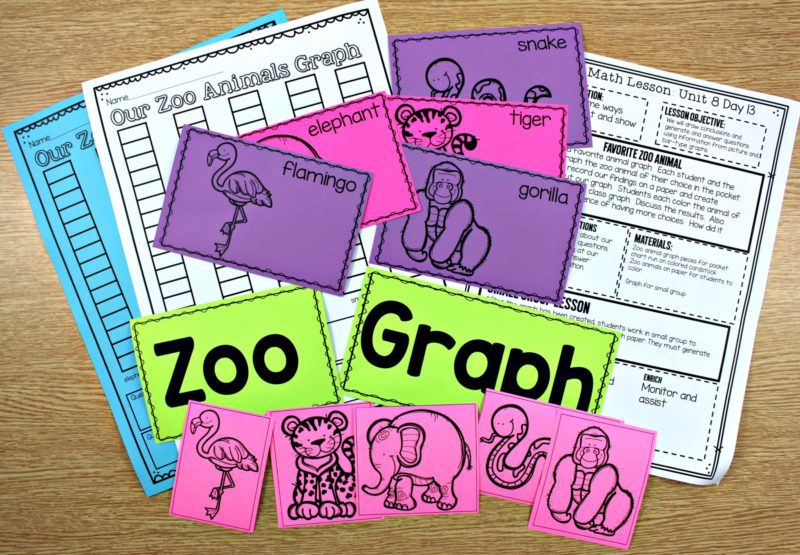
Which zoo animal is your favorite?
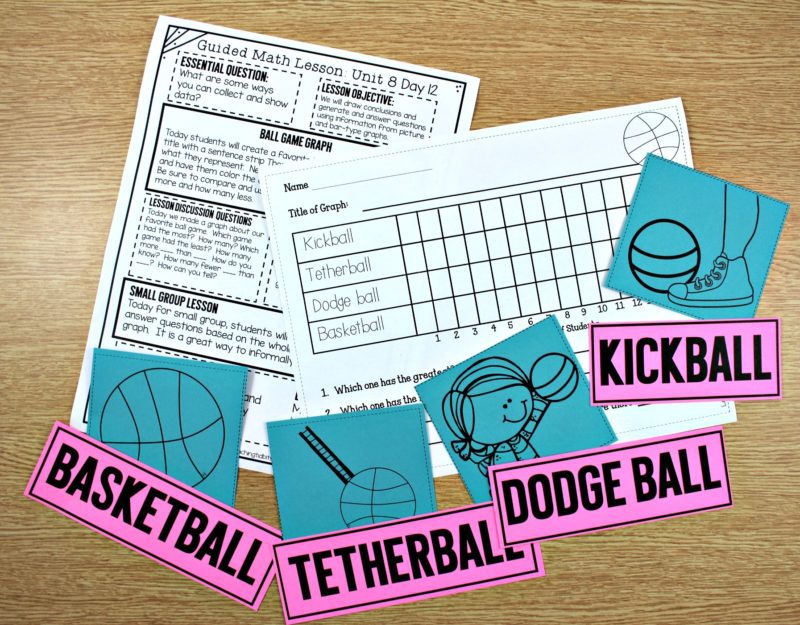
Favorite game to play with a ball
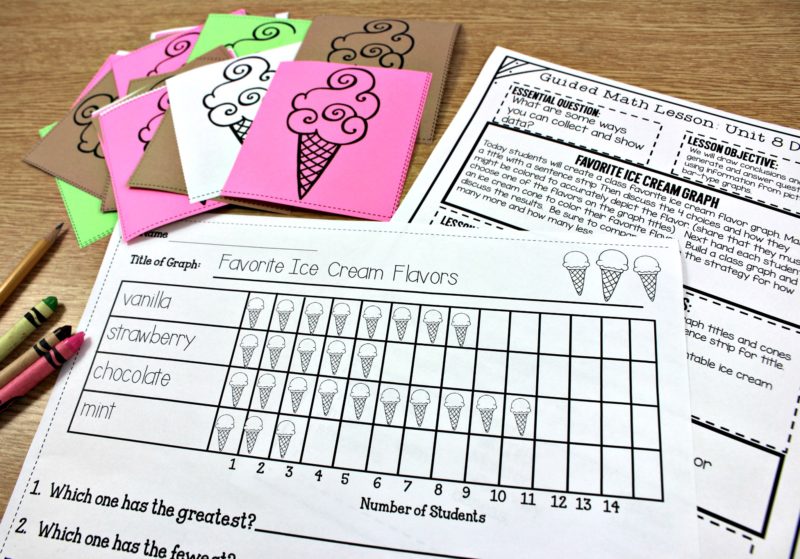
Favorite flavor of ice cream
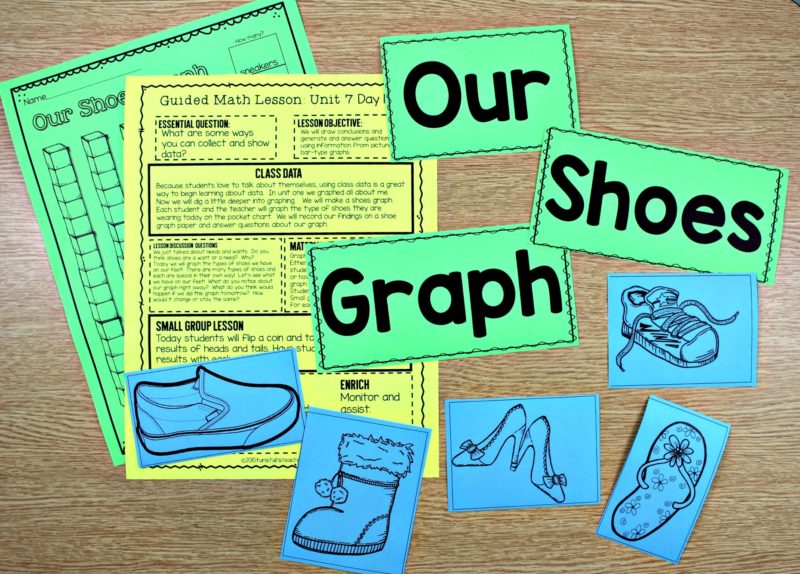
Which type of shoes do we wear?
T-Charts and Probability
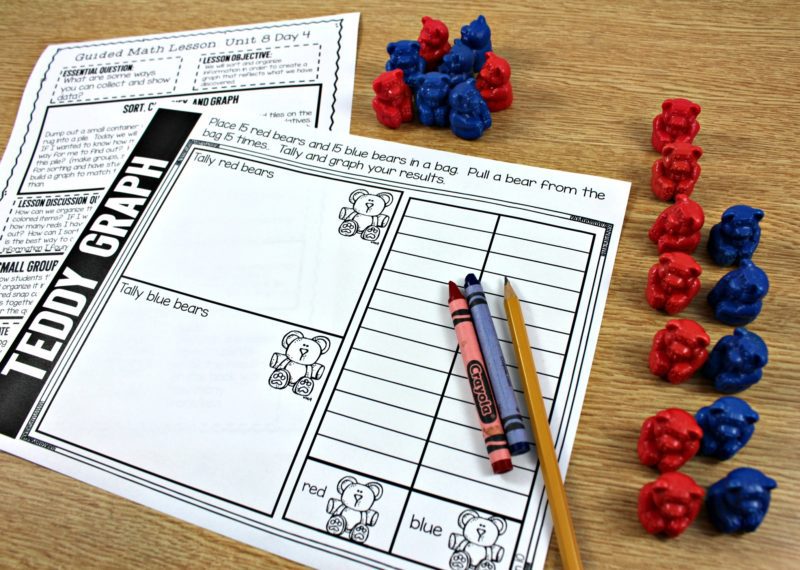
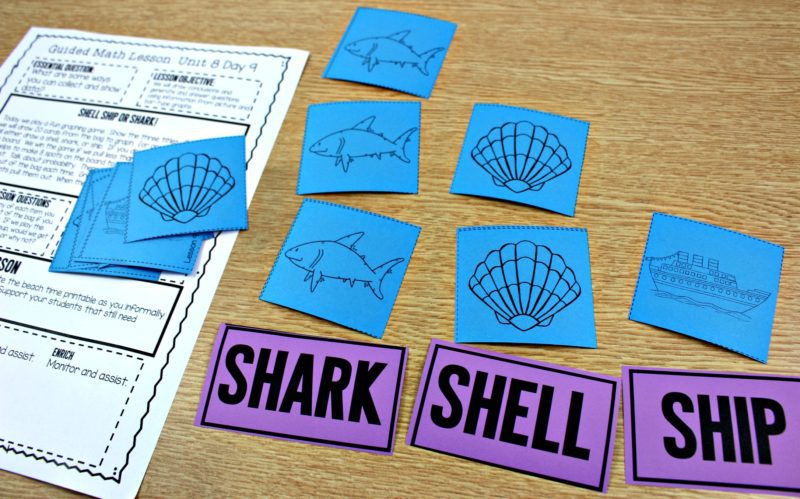
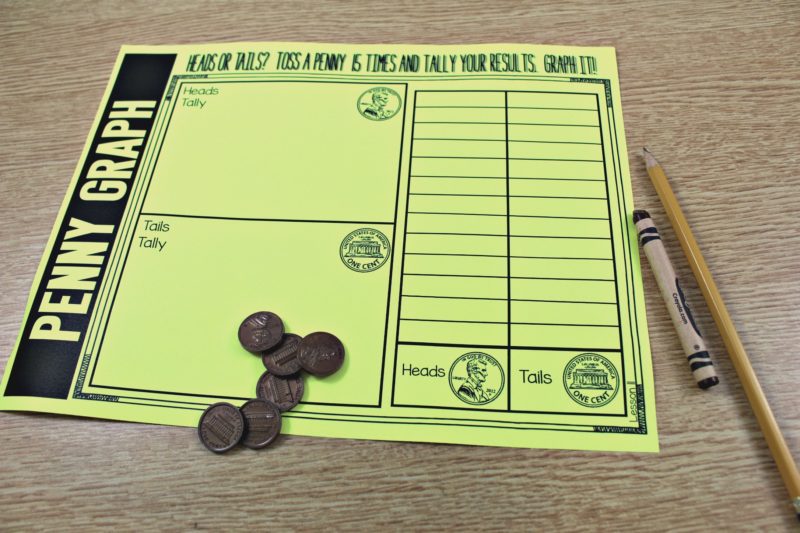
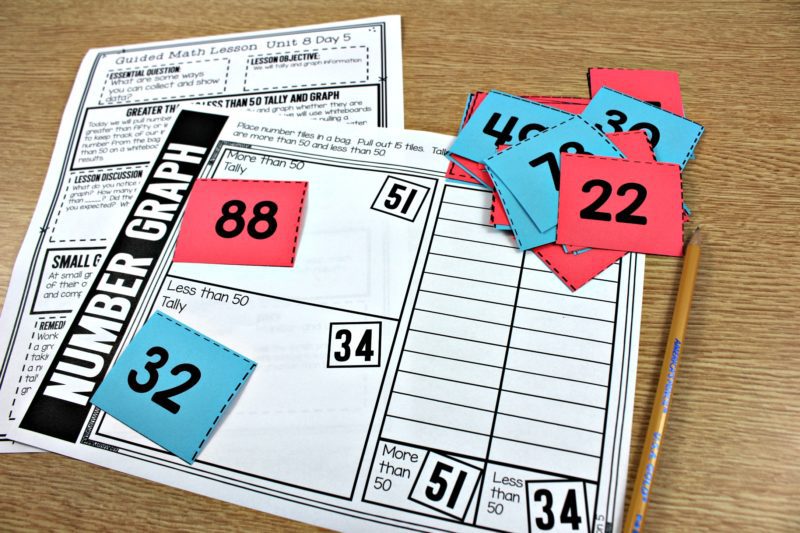
Once students have an idea of pictographs and bar graphs, we want to introduce the T-Chart and probability! Students love to compare their results to their friends results. Taking advantage of this natural curiosity is fun! For the lessons in this next section, students are pulling manipulatives or cards from a bag to reveal the results. They then tally and graph their results. Once they have completed this, they compare with a study buddy to talk about the results
Shell, Ship, or Shark!
Toss a Penny- Heads or Tails Graph and Tally
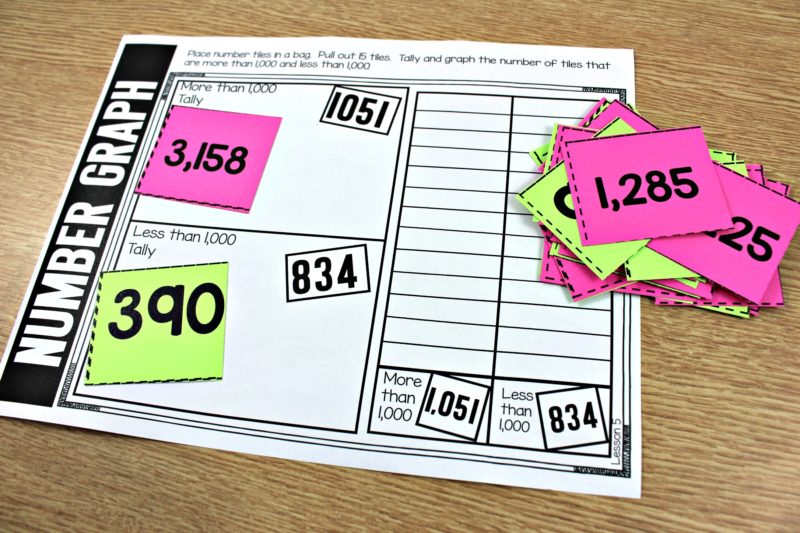
Number Sense graphing. More than or less than 50.
This is the same graph, but this time is is more than 1,000 or less than 1,000
Independent Student Graphing
With every math concept, our students need to be responsible for applying what they know in their daily explorations. There are daily graphing activities for students to do independently. The guided math series gives you both whole group and small group lessons and materials.
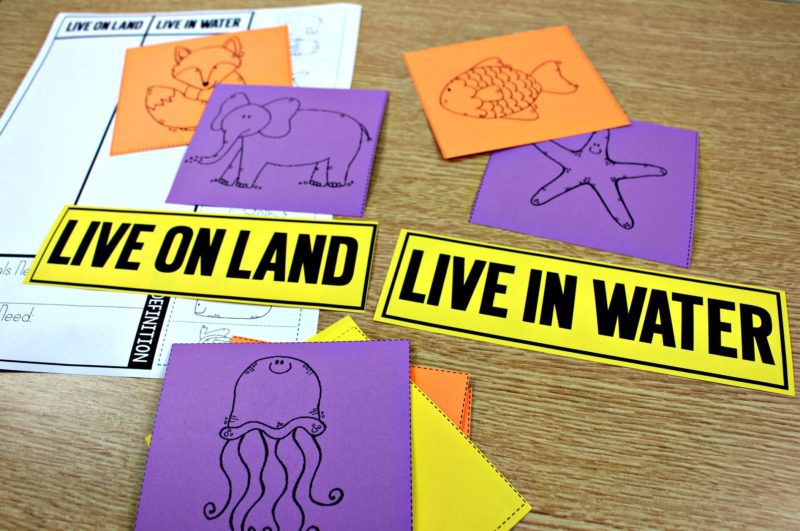
T-Chart- Live on land or live in water
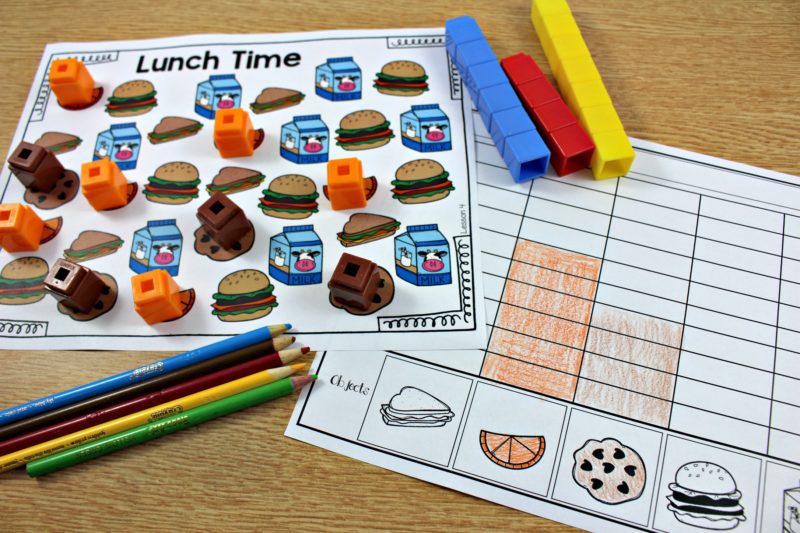
Count and graph from a given set of pictures
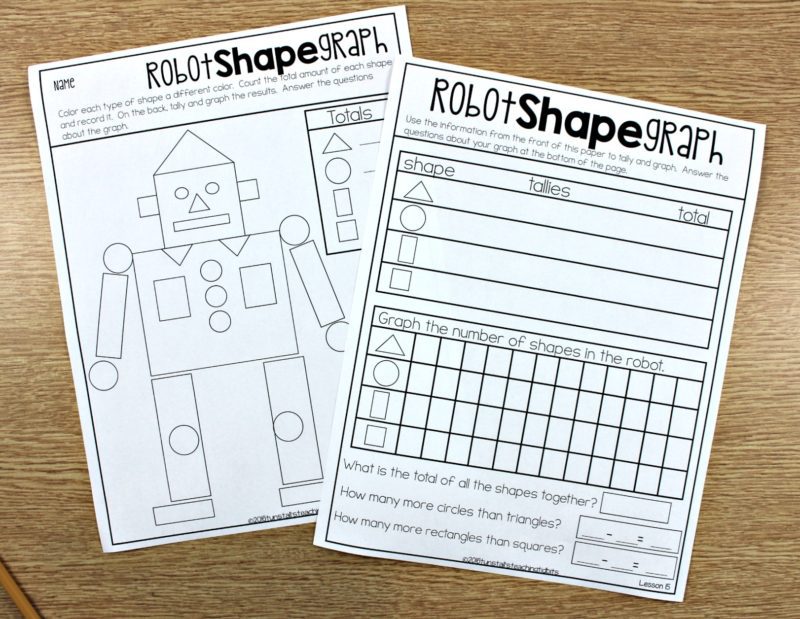
Robot Graphing- study, count, tally, and graph
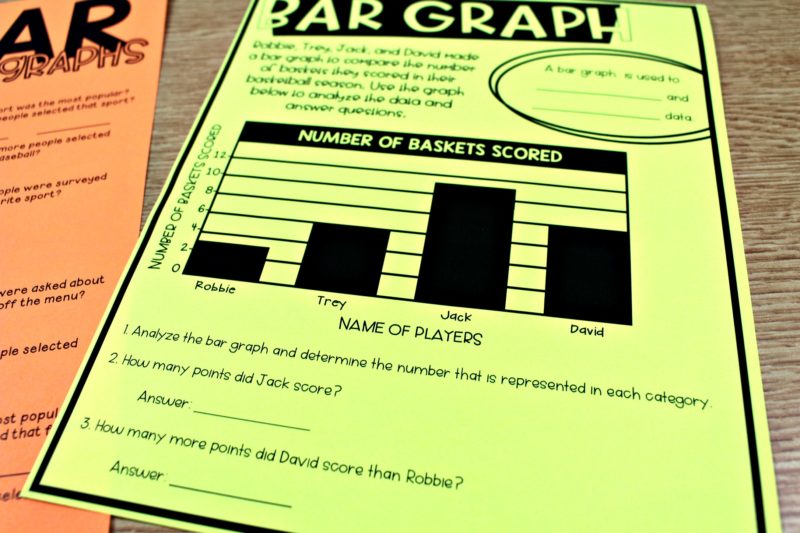
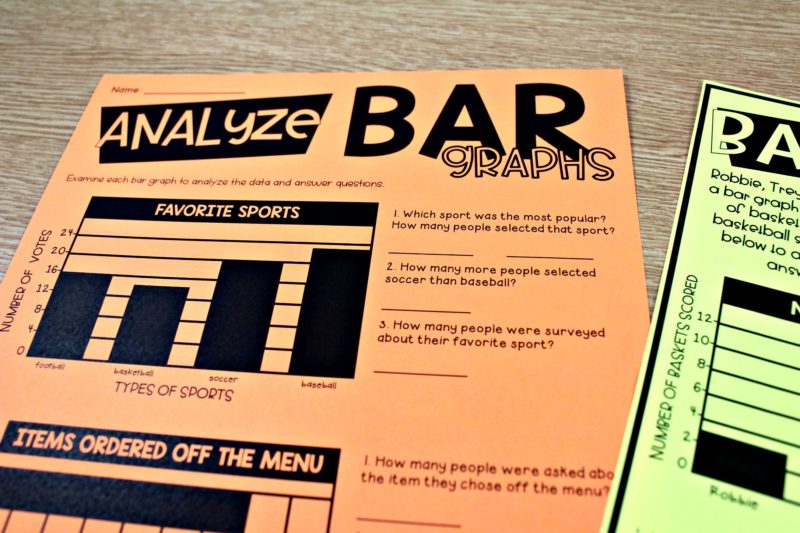
Organizing given information into a bar graph
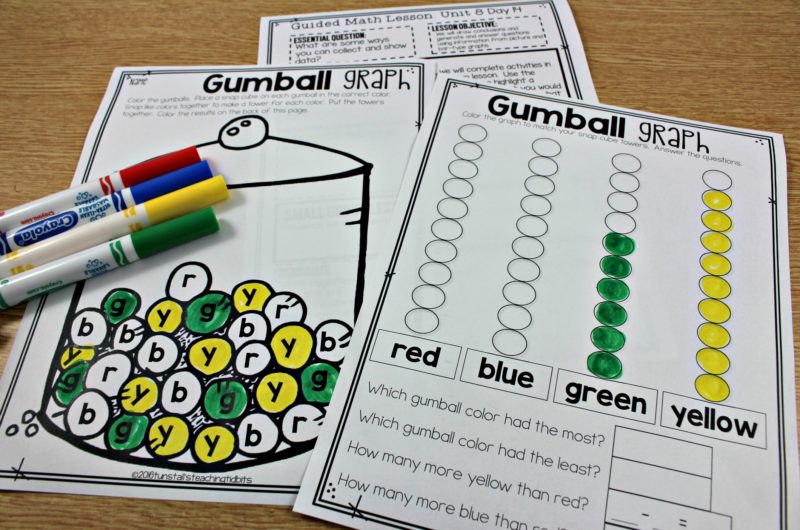
Gumball graph- color, count, graph, and analyze
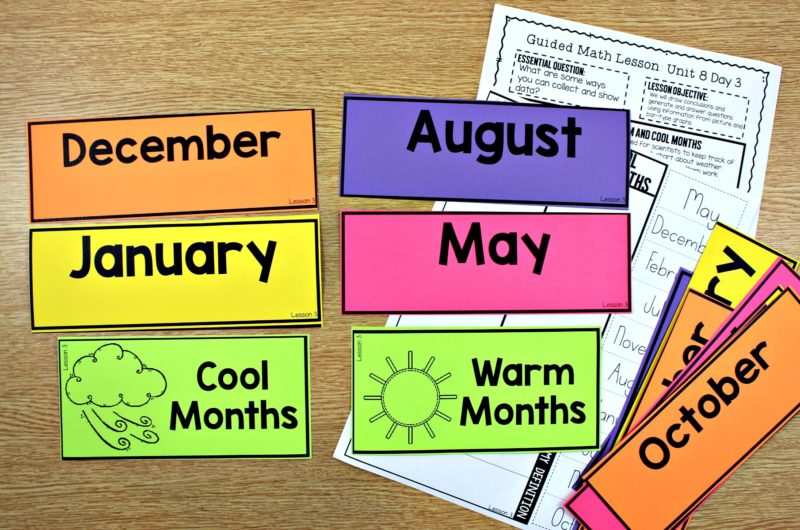
Warm and Cool Months- Students graph the months by the temperature most associated with the months and then create a T-Chart with the information
Student Created Graphs
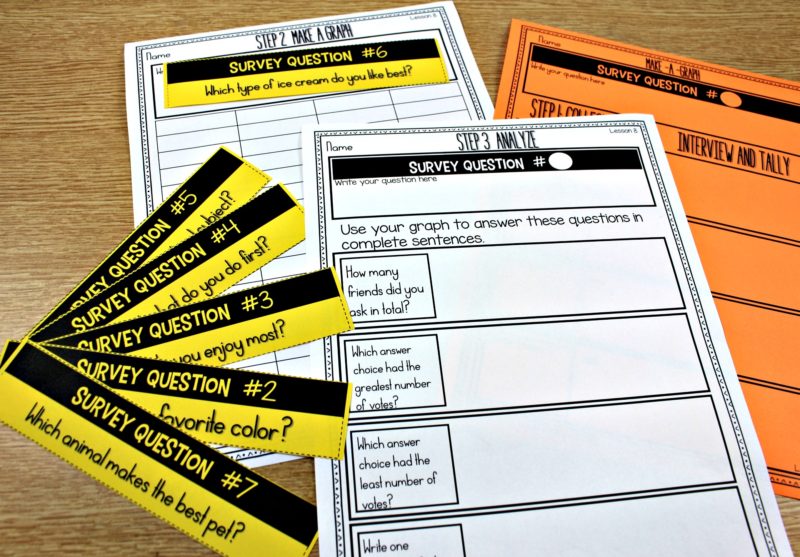
Once students have a solid understanding of these graphing concepts, it is time to allow them to experience all of the steps involved! Students will choose a survey question, gather information, create a graph, and share their results. It’s all step by step with templates to ensure success.
Second grade has more independent practice graphing activities as well.
Third Grade Data and Graphs
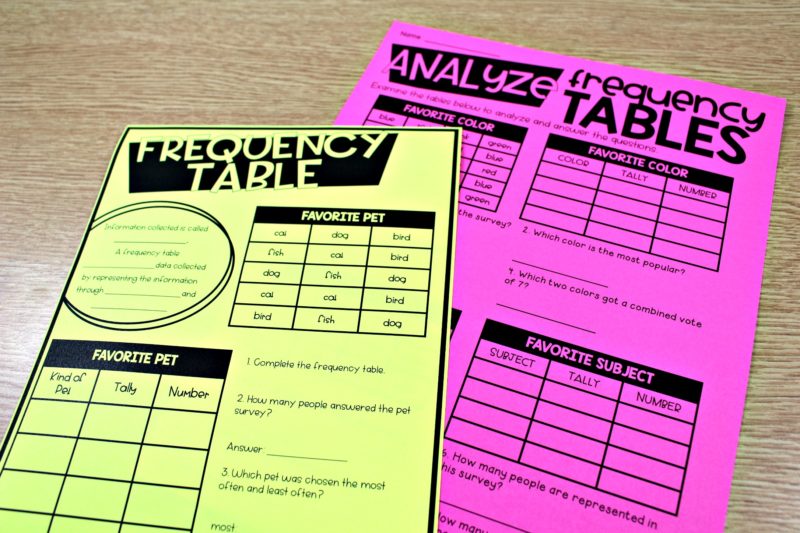
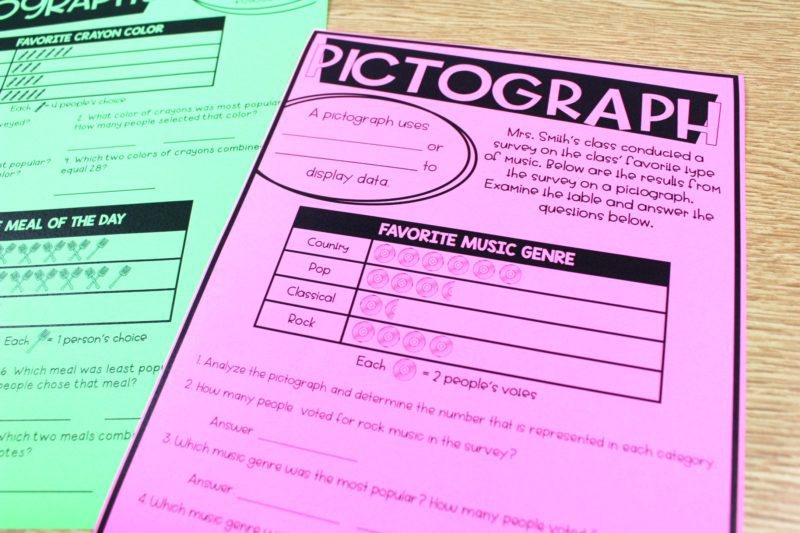
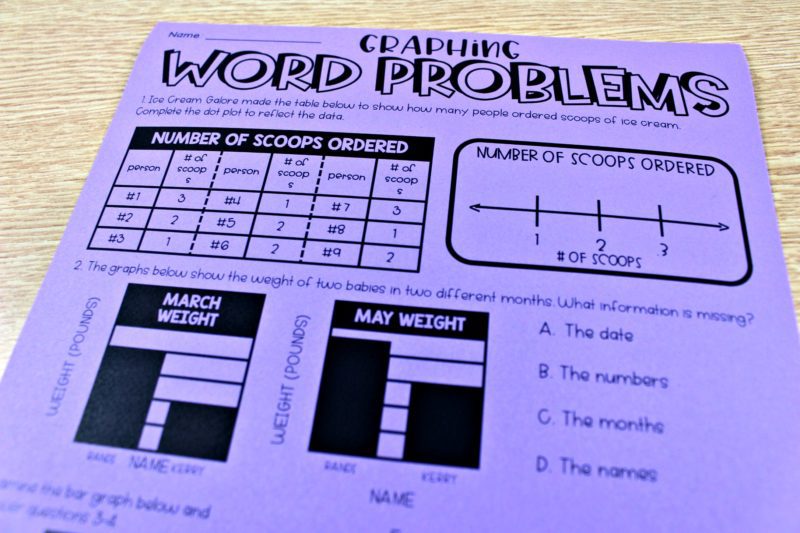
Moving into third grade graph standards, we branch out beyond the bar and pictograph. Students work more in the pictorial and abstract. For each type of graph, there are interactive notebook pages with information to be added. Then student activities to reinforce the new learning.
The graphs grow in complexity as the students are ready to apply more rigorous math skills.
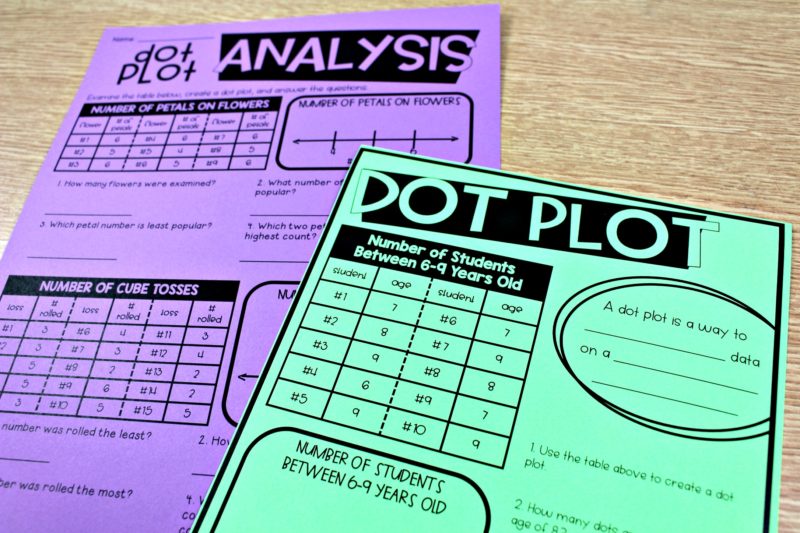
Dot plot, Frequency, and Pictographs
Students work on understanding the different types of graphs through the whole group and small group lessons in the third grade guided math series.
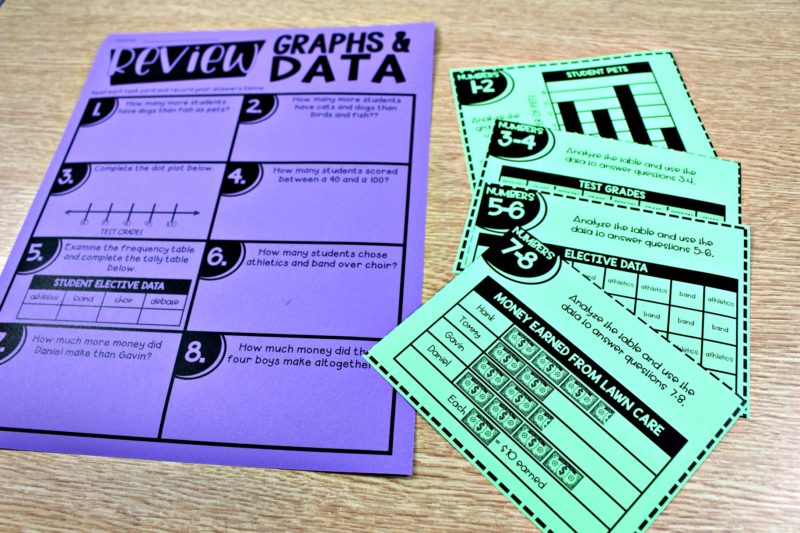
All of the guided math units have an end of unit assessment. This review lesson prepares students for this upcoming assessment.
Guided Math Graphing Units
This graphing unit in the first grade guided math series, has ten lessons on graphing and ten lessons on coins.
This second grade guided math unit on graphing spends all 20 lessons on graphing and data. Pick and choose your favorites, or teach them all!
This third grade guided math unit focuses 10 lessons on personal financial literacy and 10 lessons on graphing.
What about Kindergarten?
The kindergarten guided math series incorporates the skill of graphing, but it is not as explicit as the ideas in this post. There are graphs such as boys and girls in class, ways to go home, and our shoes. If your kinder class is ready for the graphs in this post, there is no reason not to use the units shown here. These units are standards based, but with all of the ability levels we have in our classes, it can be beneficial to check out the next grade level up or down!

 Contact Us



Does your guided math have a computer component? My principal is willing but would like computerized testing.
I have not created computer type assessments. That’s a great idea.
Is there a way for me to download the graphing templates above for purchase?
Very informative and helpful
I am taking language can any share the some suppet starter and some odea of crative writing i am taking class one.
I have noticed you don’t monetize tunstallsteachingtidbits.com, don’t waste your
traffic, you can earn extra bucks every month with new monetization method.
This is the best adsense alternative for any type of website (they approve all websites), for more
details simply search in gooogle: murgrabia’s tools
I love this! The link to your free download takes me to your TPT store, but I am unable to find the Oh Good Graph files. I would love to use them!
Where can I find the robot graphing activity?